TkMap is a program for drawing publication quality genetic maps of a set of genetic markers. TkMap is copyrighted material, but may be freely distributed under the terms of the GNU General Public License.
This page has been set up to distribute alpha (very preliminary) copies of the next version of TkMap. We've made some huge improvements in the aesthetics of the maps, and added additional functionality. Unfortunately, they are still not integrated into the full-blown GUI version of TkMap, but hey, they work!
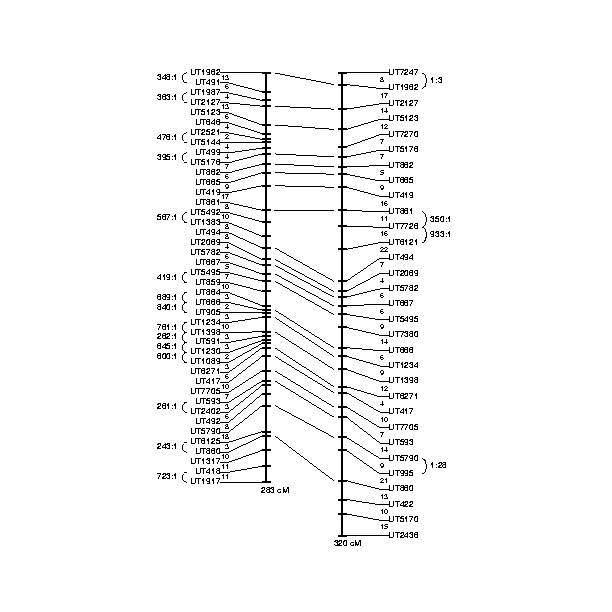
We have a perl/Tk program, mapcomp , for comparing two linear maps. It takes two map files as arguments, draws both maps to scale on the screen, and connects markers that are shared on both maps with a line. Click on the thumbnail map to see a 600x600 pixel example map.
The input to mapcomp are two tkmap files. See the TkMap man page for more infomation on the input format. In addition, you can add a third column to either map file specifying the odds against inversion for the locus in that row and the next. A sample map file is available.
If a third file name is specified on the command line, the postscript for the map will be written to it, e.g.:
% mapcomp map1.map map2.map map-1vs2.ps
will draw a comparison of map1.map and map2.map and print the results to map-1vs2.ps as Level 3 Encapsulated PostScript, suitable for import into a word processor, desktop publishing package, or printing to a PostScript device.
We changed the display of linear maps to get simpler confidence interval maps. A new program, drawconf Draws linear maps with the marker labels and intermarker distances on the left of the map axis, and confidence intervals on the right. Users find the new format simpler.
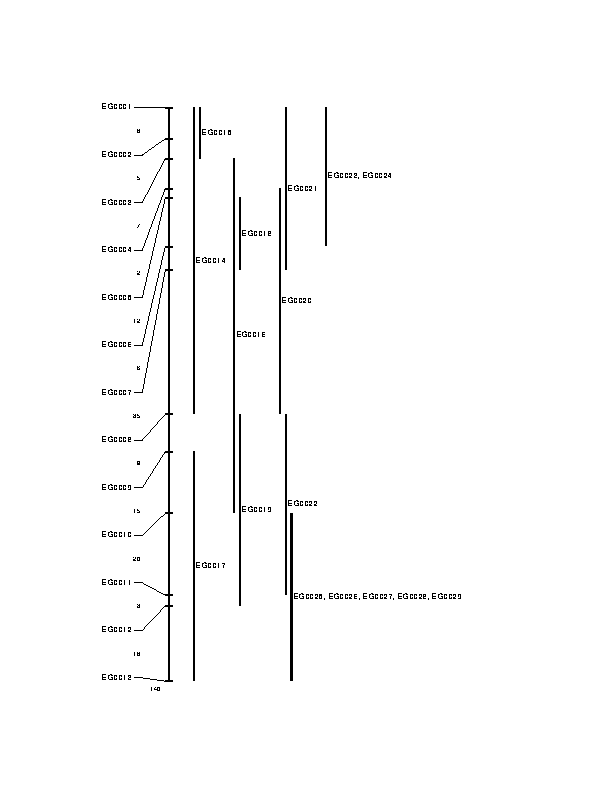
Drawconf reads a tkmap map file and a intervals file and will optionally write the postscript to a third file. The input file formats are described in the TkMap man page .
% drawconf a.map a.int a.ps
This command will draw the linear map in a.map, add the confidence intervals in a.int and write the resulting postscript to a.ps. A sample intervals file is also available.
Both mapcomp and drawconf must be edited by hand to set a number of variables controlling the appearance of the maps. Canvas size, fonts, margins etc may be changed here. One of these days I'll get a real program finished, and you'll be able to change these from menus and dialog boxes.

Most recent change: 2005/1/5 at 07:49
Generated with GTML